 With the advent of big data, media mix measurement and optimization has become a required staple in the marketer’s toolbox. Effectively media mix measurement and optimization is comprised of seven elements:
- Setting the objective of what you are trying to achieve
- Collection of media spend data
- Collection of consumer response and order/sales data
- Normalization of media spend and attribution of consumer response/order data
- Reporting of normalized data
- Analysis of historical media mix and results
- Optimization analysis and insights
In Part 1 we discussed how organizational objectives may change the implementation of a media mix and optimization platform. And in Part 2 we reviewed the collection and normalization of media spend data. In Part 3 we compared the strengths and weaknesses of order/sales attribution approaches. Today, in Part 4, we’ll discuss approaches for generating higher return of marketing investments.
Analysis of media spend result is generally focused on seven key metrics:
- Return on Marketing Investment (ROMI) – Expressed as a percentage this is
(Revenue or Profit derived from an Order minus Media Spend) divided by Media Spend
- Total Media Spend
- Total Orders/Sales
- Revenue from Orders/Sales
- Media Spend by Tactic (TV, Radio, Digital, Direct Mail, etc.)
- Attributed Orders/Sales by Tactic
- ROMI by Tactic
Depending on how the organization collected data (discussed in Part 1 and 2), these metrics can be evaluated for performance across numerous dimensions: Region, DMA, Market and Zip Code are the most common. If an organization places all media at the household (digital and direct mail centric) they will be able to include lower levels of geography (census tract, census block, etc.) and consumer dimensions such as segment, life stage, income, etc. In our experience, most organizations are limiting their investments to household- or consumer-level targeting.
For the purposes of this discussion, we will focus on geographic dimensions.
Zip codes are geographic distinct universes of consumer homes. They can be rolled up to nearly any geography, including Region, Market and DMA. The value of analyzing media metrics at the zip code level is that it provides a great deal of variability in performance. It allows the marketer to recognize where they have realized high versus low returns on their marketing investments.
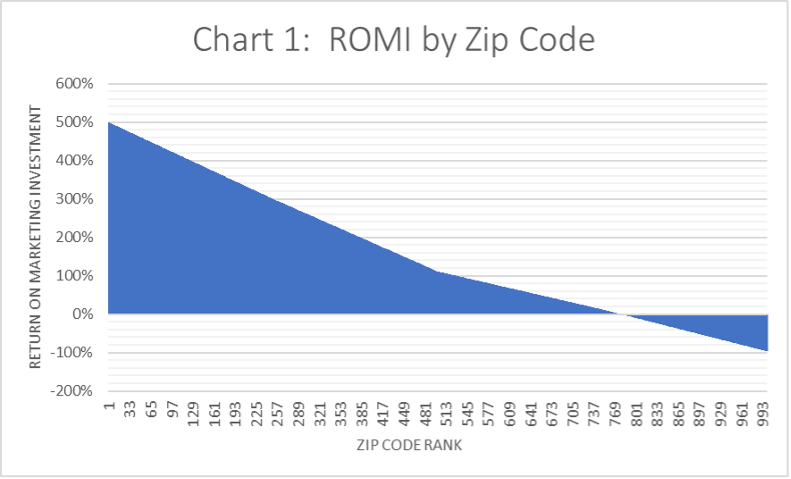
We’ll utilize a case study to highlight an approach for analyzing ROMI. We’ll assume the company’s market comprises of 1,000 zip codes. Of course, depending upon the industry, your assumptions for revenue/costs/profit, ROMI’s can vary dramatically. In the example below we calculated the ROMI by zip code aggregating all media spend by zip code, identifying all sales/orders and revenue within those zip codes and applied our assumptions regarding duration, etc. Once ROMI is calculated, we ranked the zip codes from highest ROMI to lowest. That yields Chart 1. ROMI by Zip Code
Obviously managing 1,000 data points is a challenge – we recommend aggregating these zip codes into manageable clusters – we often look at Quartiles – where the top quartile represents the best performing 25% of zip codes and the fourth quartile represents the worst performing 25% of zip codes. That data is expressed in Chart 2. ROMI by Zip Code Quartile
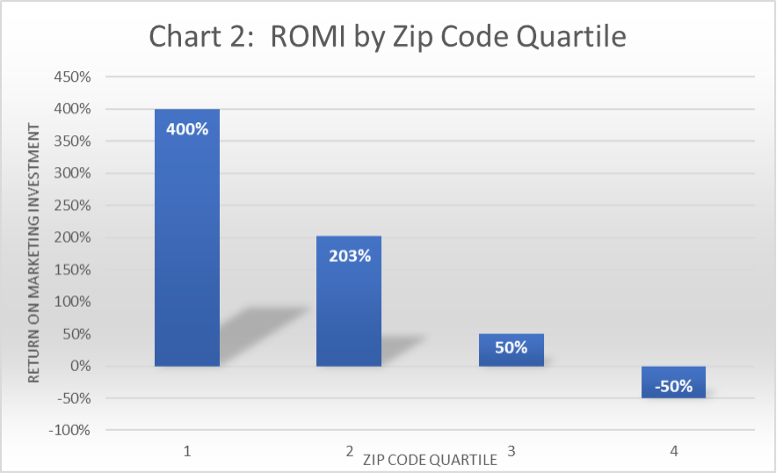
As we can see, this is far more manageable. The first quartiles ROMI is 400%, twice that of Quartile 2, eight-times higher than Quartile 3. And Quartile 4 is losing the business money, losing 50% of its investment---that means the marketing spend exceeded the revenue/profit driven realized within those zip codes by 50%.
This exercise can be duplicated for each media tactic. Of course, zip codes residing in the same DMA will have the same allocation per consumer of mass media spend (TV, Radio and perhaps some digital). In this case, scaling back on targeted media (direct mail, shared mail, digital etc.) was reduced by over 50% to Quartile 4. Those savings were redirected to Quartile 1 zip codes or captured as cost savings. Those results are expressed in Chart 3. Cost Per Order by Quartile.
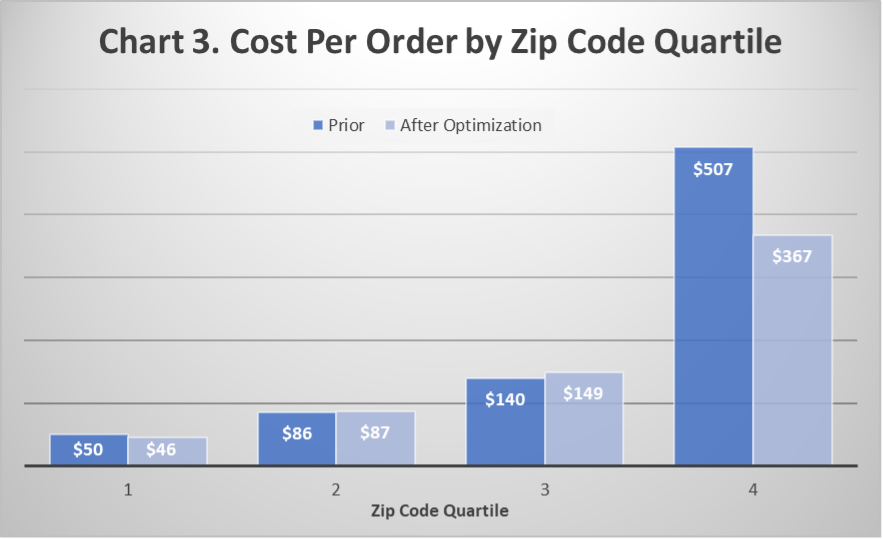
Cost per order was reduced for Quartile 4 in this case. The removal of excess media resulted in lower costs per order. ROMI was still negative, but improved to -15% from -50% prior to the investment shifts. Incremental investments in Quartile 1 resulted in improved cost per order performance of nearly 10%.
The example demonstrates the power of managing marketing investments in a manner commensurate with return. Of course, marketing strategy is and can be more complicated than that. For instance, what is driving Quartile 4 zip codes from realizing greater returns? Is it competition, pricing, product, service, company reputation, etc.? These answers can be pursued, but in the meantime, media should be placed where return is optimized.
Furthermore, optimizing media spend across tactics requires very structured tests to normalize for the effects of seasonality and DMA profiles. These type of tests requires experienced analysts to construct effective measurement to quantify results. As noted in Part 1, meaningful results can be achieved in media optimization if your solution is designed and built to meet your marketing objectives. Implementing a solution that is pragmatic and builds upon successes is paramount to success. As with anything in the marketing science arena, solutions that offer “everything” are often fraught with high costs and low returns.